You can use PivotTable, an effective technique, to slice and dice data. You will learn about these PivotTable functionalities in detail, with examples, in this tutorial. Who can use a pivot table to make a report that displays how your data is spread among several categories?
For massive data sets, pivot tables are beneficial since they make it easier to spot relationships and correlations. For instance, you can use a pivot table to determine which people are spending the most money if you have a list of customers and their purchase histories.
When analyzing data in Excel, pivot tables can help you save a tonne of time because they are quick to construct and utilize.
How To Create A Pivot Table For Analysing Data.
How can we use these techniques to make a pivot table for data analysis?
Fill out a set of rows and columns with your data.
Sort your data based on a particular attribute.
To build your pivot table, highlight the cells.
Add a field by dragging it into the “Row Labels” section.
Add a lot by dragging it into the “Values” section.
Adjust your calculations as needed.
Now that you know the various applications for pivot tables let’s delve into the specifics of building one.
For example, You might find that your pivot table’s data needs to be organized differently than you’d prefer. Excel’s Sort tool can be helpful in this situation. If you need to include data from another source in your results, the VLOOKUP function can be appropriate.
A Pivot Table’s Activation Process
To activate a pivot table, do the following:
Choose the data you want to incorporate into the pivot table.
Select PivotTable from the Insert tab.
Choose the area that you chose in step 1 in the Create PivotTable dialogue box, and then click OK.
Drag the data you want to utilize to the regions where you want them to appear in the pivot table layout from the PivotTable Item List pane.
To change the pivot table arrangement, use the controls in the PivotTable Tools men
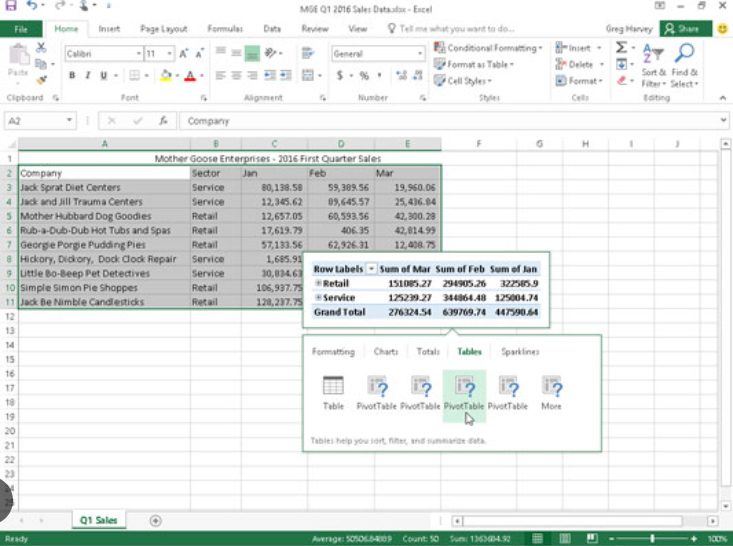
How To Add A Pivot Table in Excel
To construct a pivot table, adhere to these guidelines. Using the given information
Anywhere in the dataset can be clicked.
Select Pivot Table by going to Insert > Tables.
To default settings in the create pivot table dialogue box are usually adequate.
Click OK.
The Pivot Table is added to a separate worksheet once you click OK.
You wouldn’t see any data in the Pivot Table even if it were created. On the left, you would know the title of the pivot table and a single line of instructions, whereas on the right, you Pivot Table Fields.
Conclusion
Excel’s pivot tables are a fantastic tool for organizing data. Data highlights by category, month, or year can be made using them. Who can discover data trends over time using pivot tables as well? Excel’s pivot tables are an effective tool for summarising data. They can be a helpful tool for spotting trends in data and are straightforward when used.


")
![Download free DLS 23 Mod APK [ Unlimited Coins and Diamond ]](data:image/svg+xml,%3Csvg%20xmlns='http://www.w3.org/2000/svg'%20viewBox='0%200%20150%20150'%3E%3C/svg%3E "Download free DLS 23 Mod APK [ Unlimited Coins and Diamond ]")
")
")
![Download free DLS 23 Mod APK [ Unlimited Coins and Diamond ]](https://whosgrip.com/wp-content/uploads/2023/08/Download-free-DLS-23-Mod-APK-Unlimited-Coins-and-Diamond-.webp "Download free DLS 23 Mod APK [ Unlimited Coins and Diamond ]")
")
")
")
